How to Analyse HAR / Browser / Network Trace Logs
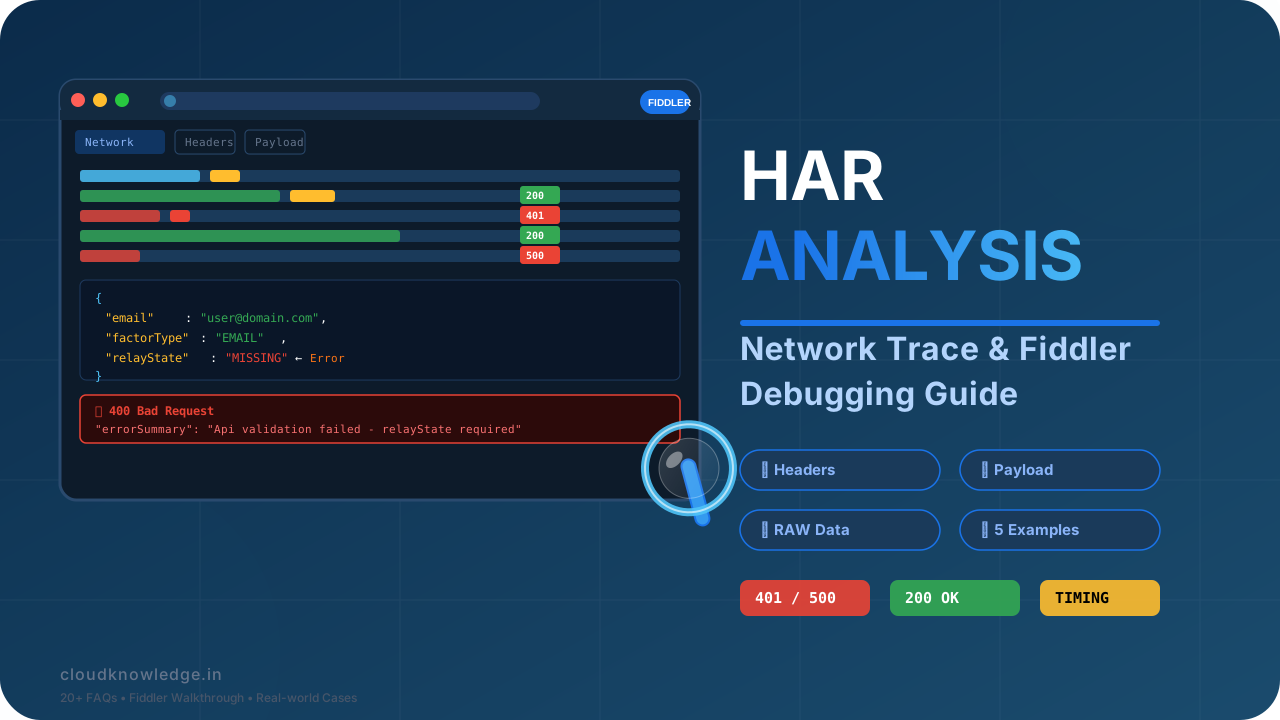
 Table of Contents
- 1. Introduction
- 2. What Is a HAR File?
- 3. Step‑by‑Step: Capture & Analyse
- 4. Which Values to Check
- 5. What Headers Indicate
- 6. What RAW Suggests
- 7. Payload & Response Deep Dive
- 8. Tools: Fiddler & Beyond
- 9. Troubleshooting with Fiddler
- 10. 5 Real‑World Analysis Examples
- 11. Pros & Cons
- 12. 20+ FAQs with Short Answers
- 13. Further Resources
1. Introduction: Why HAR Analysis Matters
Every modern web application, API gateway, or identity provider exchange generates a rich trail of network activity. HAR (HTTP Archive) files capture this trail in a structured JSON format, recording every request, response, header, cookie, timing, and payload. Whether you are debugging a failed Okta password reset flow, investigating a provisioning sync issue in Entra ID, or verifying authentication policies, HAR analysis is the single most effective technique to see exactly what the browser and server said to each other.
This guide is written for IAM engineers, cloud architects, developers, and support professionals. We will walk through every aspect of HAR analysis — from capturing a trace to reading headers, inspecting raw data, understanding payloads, and using tools like Fiddler to troubleshoot errors. Along the way, we reference expert resources from the Cloud Knowledge YouTube channel, the Cloud Knowledge Blog, and in‑depth Medium guides on Okta interviews and Azure Kubernetes Service.
 Figure 1: HAR file structure overview(JSON containing entries, request, response, timings, headers)
2. What Is a HAR File?
A HAR (HTTP Archive) file is a JSON‑formatted log of all network interactions between a browser (or any HTTP client) and the servers it communicates with. The format is defined by the W3C Web Performance Working Group and is supported by all major browsers, as well as tools like Fiddler, Charles Proxy, and Postman. A typical HAR file contains:
- log.entries – an array of request/response pairs, each with timings, headers, body size, and status.
- request – method, URL, HTTP version, headers, query string, and post data.
- response – status, headers, content (body), and encoding.
- timings – blocked, dns, connect, send, wait, receive, and SSL details.
- cookies – both sent and received.
HAR is the universal language of network debugging. If you can read HAR, you can troubleshoot almost any web‑based integration — from Okta password reset to device management in Entra ID.
3. Step‑by‑Step: Capture & Analyse a HAR Trace
3.1 Capture from Browser (Chrome / Edge / Firefox)
- Open DevTools (F12 or Ctrl+Shift+I).
- Switch to the Network tab.
- Check "Preserve log" to keep entries across page loads.
- Reproduce the issue (e.g., failed login, slow API, provisioning error).
- Click Export HAR (
 icon) and save the file.
3.2 Capture with Fiddler Classic / Fiddler Everywhere
- Launch Fiddler and ensure Capture Traffic is enabled.
- Reproduce the scenario.
- Go to File → Save → All Sessions and choose HAR format.
- Alternatively, use Export Sessions → HTTP Archive v1.2.
3.3 Analyse the HAR
- Open the HAR file in a JSON viewer or a dedicated HAR analyser (e.g., HAR Viewer, Fiddler, Postman).
- Filter by status codes: focus on
4xx(client errors) and5xx(server errors). - Check timings to spot bottlenecks.
- Inspect request headers for auth tokens, content‑type, and referer.
- Examine response payload for error messages or stack traces.
Figure 2: Export HAR from Chrome DevTools(Network tab → Export HAR)4. Which Values to Check in a HAR File
Not all HAR entries are equally important. When analysing a trace, focus on these critical values:
- Status Code –
200(OK),301/302(redirect),401(unauthorised),403(forbidden),404(not found),500(internal error),502(bad gateway),504(timeout). - Request URL – the exact endpoint being called; verify path and query parameters.
- Request Method –
GET,POST,PUT,DELETE,PATCH. - Response Time (wait + receive) – high values indicate server or network latency.
- Content‑Length – size of the response body; unexpectedly large or small payloads can be a red flag.
- Cache‑Control / Expires – caching behaviour can cause stale data.
- Set‑Cookie / Cookie – session management and state.
- Authorization / Bearer – token presence and validity.
- User‑Agent – client identification; mismatches can lead to compatibility issues.
- Referer / Origin – helps trace the flow and detect CORS problems.
For identity‑related troubleshooting, also look for SAML or OIDC specific parameters in the payload or query string. Our guide on Authentication Policies in Okta explains how policy rules affect these exchanges.
5. What Headers Indicate
HTTP headers carry metadata that often reveals the root cause of an issue. Here is what key headers tell you:
Authorization: Bearer <token>– the token is present; if missing, the client is not authenticated. If present but the server returns401, the token may be expired or invalid.Content‑Type–application/json,application/x‑www‑form‑urlencoded,multipart/form‑data, etc. Mismatch betweenContent‑Typeand actual body format is a common error.Accept– what the client expects; if the server returns a different format, the client may fail to parse.Set‑Cookie– the server is trying to establish a session; if the client does not send it back in subsequent requests, session state is lost.X‑Requested‑With– often used to differentiate AJAX requests from normal browser navigation.X‑Forwarded‑For– the original client IP; useful when debugging proxy or load‑balancer setups.Location(in response) – indicates a redirect; check if the redirect URL is correct.WWW‑Authenticate– the server’s challenge for authentication; often seen with401responses.
In complex IAM scenarios, headers like X‑Okta‑Request‑Id or X‑MS‑Request‑Id can be correlated with server‑side logs. For deeper insight, refer to our Entra ID Provisioning and Device Management in Entra ID guides.
6. What RAW Suggests
The RAW view in Fiddler or HAR viewers shows the exact bytes sent over the wire, including the request line, headers, and body. Analysing RAW data helps you:
- Detect malformed JSON or XML – a missing comma or unescaped character can break parsing.
- Verify line endings and encoding –
Content‑Encoding: gzipmeans the body is compressed; you must decode it before reading. - Spot hidden characters – sometimes BOM (Byte Order Mark) or non‑printable characters sneak in.
- Confirm exact request string – including the HTTP version (
HTTP/1.1orHTTP/2). - Check chunked transfer encoding –
Transfer‑Encoding: chunkedmeans the body is sent in parts.
When a request fails with a 400 Bad Request, the RAW view often reveals that the body does not match the expected schema. This is especially common in PowerShell network troubleshooting scripts that construct HTTP requests manually.
7. Payload & Response Deep Dive
7.1 Request Payload
The payload (or body) of a POST/PUT/PATCH request contains the data being sent to the server. Check for:
- JSON structure – validate required fields, data types, and nested objects.
- Form data – key‑value pairs; look for missing or misspelled keys.
- File uploads – multipart boundaries and file names.
- OAuth / OIDC parameters –
grant_type,client_id,client_secret,code,redirect_uri.
7.2 Response Payload
The response body contains the server’s answer. Key things to examine:
- Error messages – often in a
errorormessagefield. - Stack traces – may reveal internal server errors.
- Validation errors – field‑level issues (e.g.,
"password must be at least 8 characters"). - Tokens –
access_token,id_token,refresh_token. - Pagination metadata –
nextLink,totalCount, etc.
For identity flows, the response payload often includes a sessionToken or state parameter that must be carried forward. Our Okta password reset guide shows exactly how these payloads are structured in a recovery flow.
8. Tools That We Use: Fiddler, HAR Viewers, and More
Several tools can capture, view, and analyse HAR files. The most popular are:
- Fiddler Classic / Fiddler Everywhere – the industry‑standard proxy for HTTP debugging. Allows you to inspect, modify, and replay requests. Supports HAR export/import.
- Chrome DevTools – built‑in network tab with HAR export, filtering, and timing breakdown.
- Postman – can import HAR files and convert them to collections for replay.
- HAR Viewer – online or offline tools that visualise HAR data in a readable format.
- Charles Proxy – similar to Fiddler, with advanced SSL proxying and bandwidth throttling.
- Wireshark – for lower‑level packet analysis, though HAR is higher‑level.
For cloud and identity professionals, Fiddler remains the go‑to because of its extensibility, session comparison, and rule‑based breakpoints. You can also use PowerShell to automate HAR analysis or trigger network traces on demand.
9. How to Troubleshoot and Analyse Errors with Fiddler
Fiddler is not just a capture tool; it is a powerful troubleshooting engine. Here is a systematic approach to using Fiddler for HAR analysis:
- Capture the session – ensure Decrypt HTTPS is enabled to see encrypted traffic.
- Find the failing request – use the Search bar or filter by status code (
4xx,5xx). - Inspect the Inspector tabs – switch between Headers, TextView, JSON, RAW, and WebForms.
- Compare with a successful request – use Compare or Diff to spot differences.
- Set breakpoints – use Rules → Automatic Breakpoints → Before Requests to modify requests on the fly.
- Replay the request – right‑click and select Replay → Reissue to test fixes.
- Check the Timeline – the Timeline tab shows the sequence and duration of each request.
Figure 3: Fiddler – Inspecting a 401 Unauthorized response(Headers tab showing WWW‑Authenticate challenge)A common scenario: a 401 response with a WWW‑Authenticate: Bearer header indicates the token is missing or invalid. Use Fiddler’s AutoResponder to mock a valid token and test the rest of the flow. For deeper identity debugging, refer to our Authentication Policies in Okta guide, which explains how policy rules affect token issuance.
10. 5 Real‑World Analysis Examples
 Example 1: Okta Password Reset – 400 Bad Request
Scenario: A user tries to reset their password via the Okta API, but receives a 400 with "errorCode": "E0000001".
HAR Analysis:
- Request payload:
{ "email": "user@example.com", "factorType": "EMAIL" } - Response:
{ "errorCode": "E0000001", "errorSummary": "Api validation failed" } - Root cause: The
relayStateparameter was missing from the request body. - Fix: Add
"relayState": "distributor"to the payload.
See our full Okta Password Reset guide for the complete flow.
Example 2: Entra ID Provisioning – 404 Not Found
Scenario: An Entra ID provisioning job fails with a 404 when trying to update a user in a SaaS app.
HAR Analysis:
- Request URL:
https://api.saas.com/scim/v2/Users/abc123 - Response:
{ "status": "404", "detail": "User not found" } - Root cause: The user ID in the URL does not exist in the target system.
- Fix: Check the source anchor mapping in the provisioning schema.
Deep dive into Entra ID Provisioning for mapping rules.
Example 3: CORS Preflight Failure
Scenario: A SPA cannot call an API; the browser shows a CORS error.
HAR Analysis:
- An
OPTIONSrequest is sent first (preflight). - Response status:
403or404. - Missing
Access‑Control‑Allow‑Originheader in the response. - Root cause: The server is not configured to accept requests from the SPA’s origin.
- Fix: Add the appropriate CORS headers on the server.
This is a classic issue when integrating with identity providers; see our Authentication Policies guide for context.
Example 4: Slow Device Registration – High Latency
Scenario: Device registration in Entra ID takes > 10 seconds.
HAR Analysis:
- Check timings:
waitis 9.8 seconds,receiveis 0.2 seconds. - The server is processing the request slowly.
- Root cause: The backend is throttled or the device is being evaluated against many conditional access policies.
- Fix: Optimise conditional access policies or scale the backend.
Learn more about Device Management in Entra ID.
Example 5: SAML SSO – 403 Forbidden
Scenario: A user tries to log in via SAML SSO but gets a 403.
HAR Analysis:
- The SAML response is sent as a
POSTto the ACS URL. - Response body:
"Invalid audience restriction". - Root cause: The
Audiencevalue in the SAML assertion does not match the SP’s entity ID. - Fix: Correct the audience configuration in the IdP.
Our Okta Password Reset and Authentication Policies guides cover similar assertion‑level issues.
11. Pros & Cons of HAR Analysis
 Pros
Pros
- Non‑intrusive – captures traffic without modifying the application.
- Rich detail – includes headers, bodies, timings, and cookies.
- Widely supported – all browsers and most debugging tools export/import HAR.
- Replayable – requests can be replayed to test fixes.
- Correlatable – request IDs can be matched with server‑side logs.
- Portable – HAR files can be shared with team members for collaborative debugging.
 Cons
Cons
- Can be huge – large HAR files are difficult to parse manually.
- Privacy concerns – may contain sensitive data (tokens, passwords, PII).
- Not suitable for UDP/WebSocket – HAR only covers HTTP/HTTPS.
- No server‑side insight – only shows what the client sees.
- Requires context – raw HAR data is meaningless without understanding the application flow.
- JSON parsing overhead – large files can be slow to load in some viewers.
12. 20+ FAQs with Short Answers
A:HTTP Archive. It is a JSON format for logging HTTP transactions.
A:Use Chrome DevTools (Import HAR), Fiddler, Postman, or any JSON viewer.
A:Yes, if they are sent in the request body or URL. Always sanitise before sharing.
A:HAR is application‑level (HTTP/HTTPS), while PCAP is network‑level (all packets).
A:In DevTools or Fiddler, filter by status code 4xx and 5xx.
A:The time from when the request was sent to when the first byte of the response was received (server processing time).
A:Look for Cache‑Control: max‑age or If‑Modified‑Since headers.
A:An OPTIONS request sent by the browser to check CORS permissions before the actual request.
A:Most HAR viewers (Fiddler, DevTools) decode it automatically. In raw JSON, you need to base64‑decode and then gunzip.
A:401 means missing or invalid authentication; 403 means authenticated but not authorised.
A:Yes, use theComposertab or right‑click →Replay → Reissue and Edit.
A:Use Fiddler as a proxy, or use Safari Web Inspector (iOS) or Chrome Remote Debugging (Android).
Transfer‑Encoding: chunked mean?A:The body is sent in chunks; the size of each chunk is indicated before the chunk data.
A:Look for custom headers like X‑Request‑Id, X‑Correlation‑Id, or X‑Okta‑Request‑Id.
A:A visual representation of request timings, showing the sequence and duration of each phase.
A:Yes, they can be replayed in tools like JMeter or Postman to simulate load.
Connection: close indicate?A:The server will close the TCP connection after the response.
A:File → Save → All Sessions → choose HAR format.
A:Absolutely. It shows the SAML/OIDC exchanges, redirects, and token issuance.
A:Use a streaming JSON parser, or filter the HAR to only include relevant entries before opening.
A:Yes, using PowerShell or Python scripts to parse the JSON and extract errors.
application/x‑www‑form‑urlencoded and multipart/form‑data?A:The first encodes key‑value pairs in the URL, the second is used for file uploads.
13. Further Resources
Extend your knowledge with these expert‑curated resources from the Cloud Knowledge ecosystem:
- YouTube: Cloud Knowledge Channel – video deep dives on IAM, Entra ID, and Okta.
- Blog: Cloud Knowledge Blog – practical guides and troubleshooting tips.
- Medium – Okta Interview Guide: 40 Questions from Basics to Enterprise Architecture.
- Medium – AKS Deep Dive: Azure Kubernetes Service (AKS) Complete Guide.
- Tumblr – Okta Interview Prep: Prepping for an Okta or IAM Interview.
- Tumblr – Entra ID Provisioning: The Ultimate Guide to Automated Identity Lifecycle Management.
- Blog – AWS Security Best Practices: 7 Proven AWS Security Best Practices.
- Blog – Entra ID Provisioning (Full): Entra ID Provisioning: The Ultimate Guide.
For even more hands‑on troubleshooting, explore our internal guides:

Comments
Post a Comment